Introduction to 2-Variable StatisticsToday we are starting to look at statistics of 2-variables.
0 Comments
Activities with Normal Distributions
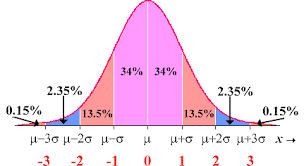
Calculating Normal Distribution Probabilities using TechnologyZ-Scores, Percentiles and the Z-Score tableToday we will practice calculating z-scores and then using a z-score table to do probability calculations and determine percentiles. Need more help?68%, 95%, 99.7% Rule
Variance and Standard DeviationToday we are learning about a very important measure of spread: The Standard Deviation Today we are learning how to find the Mean, Median, and Mode of a distribution. We will also look at finding the range (spread of data) for simple data sets. We will also look at the histograms of these distributions. Solutions will be done in two ways 1) by hand and 2) using WolframAlpha
Today we are learning how to graphically represent continuous data.
Sampling Techniques & Representing Data GraphicallyGraphing Binomial Distributions and Solving ProblemsOur last day on these types of distributions before the review for the test. We will be solving some more in depth problems with binomial distributions and also graphing the distributions. We will be creating small documents with our solutions and analysis of the problems.
|